Producer Prices Rose Just 0.3% in October, but Building Materials Are Up 6.2% in a Year, and Steel Is Up 32.9%
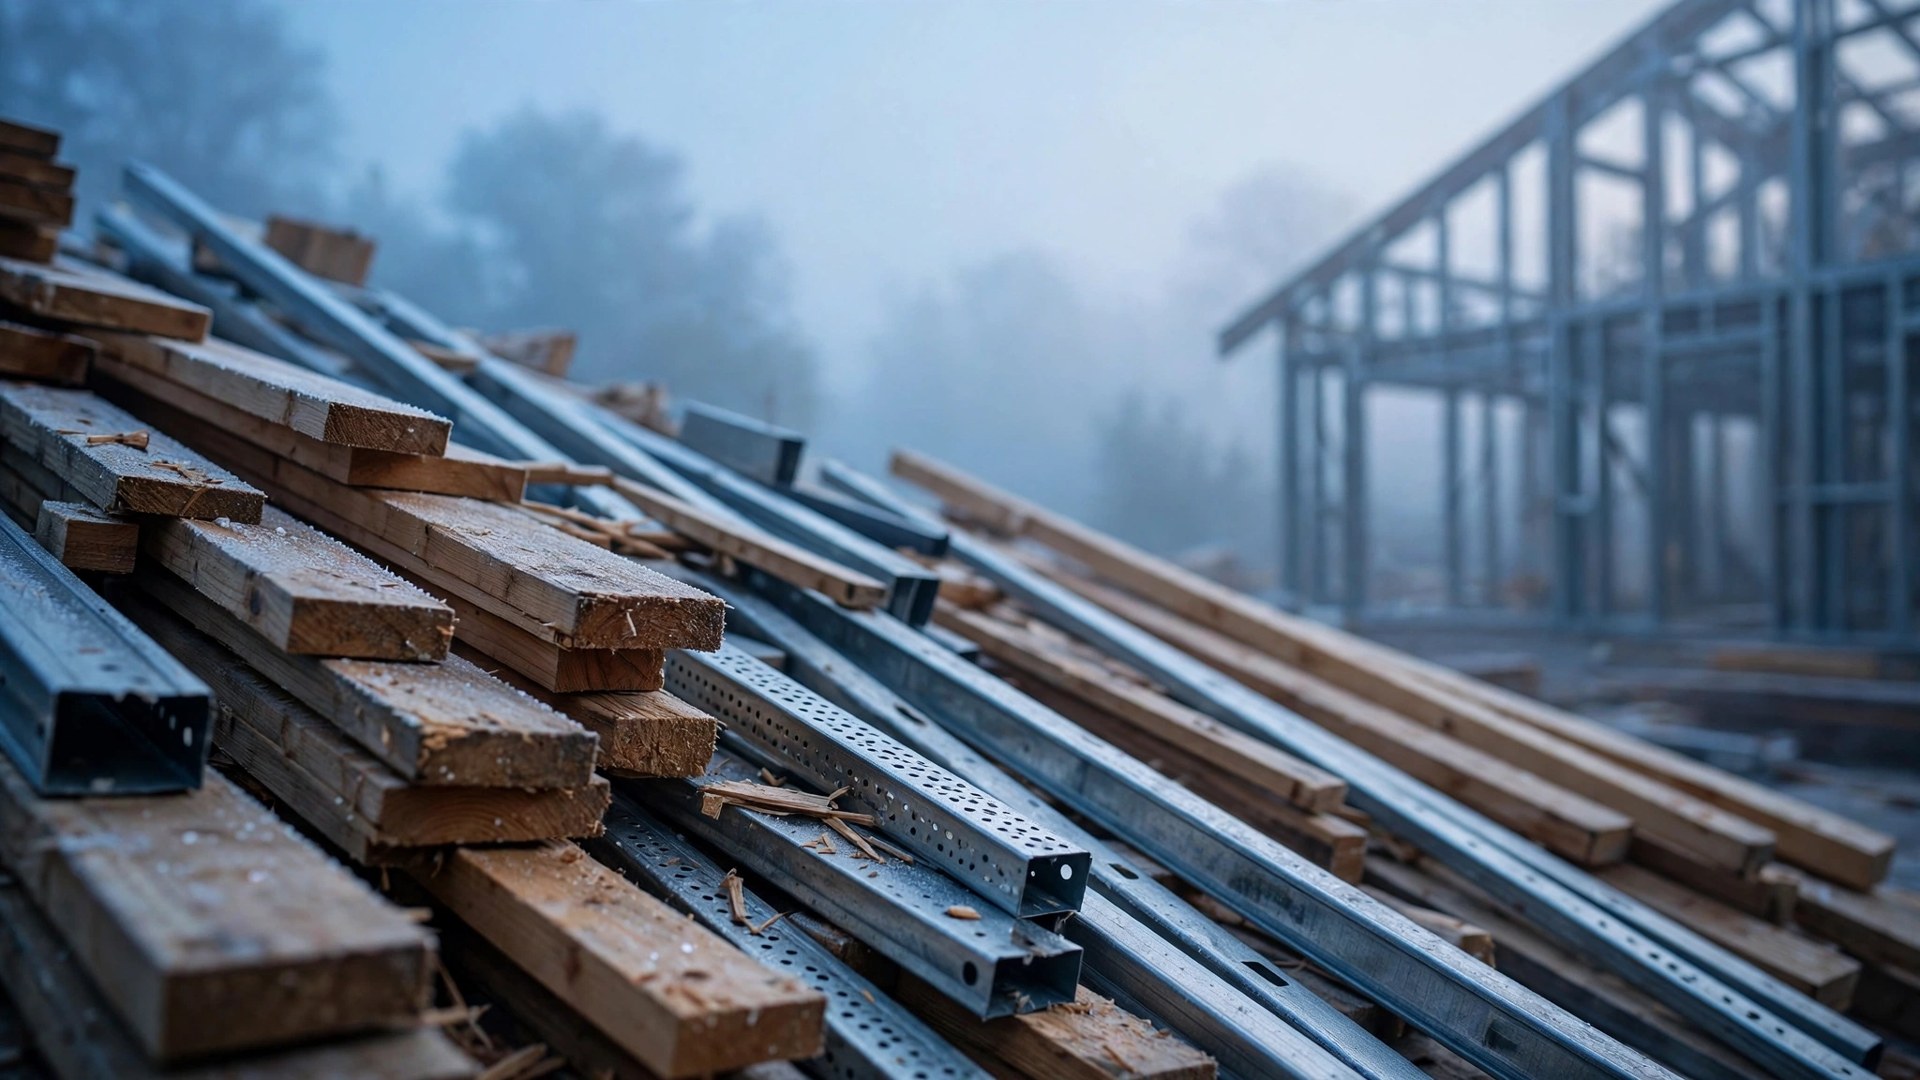
Key Takeaways
- Producer prices rose 0.3% in October 2026, a sharp slowdown from September's 1.4% jump, but the 12-month increase hit 6.5%, the largest since November 2022.
- Prices for final demand goods are up 10.2% in a year, the largest 12-month rise since October 2022, and materials and components for construction are up 6.2%.
- The construction ledger is split: steel mill products are up 32.9% in a year and plywood 16.9%, while softwood lumber fell 3.1% in October alone.
- New building construction prices are up 5.5% in a year, so a rehab or build budget priced last year is already out of date line by line, not just at the total.
Wholesale inflation cooled for one month and heated up for the year at the same time. The U.S. Bureau of Labor Statistics Producer Price Index release for October 2026, published November 13, showed final demand prices up 0.3% in October, seasonally adjusted.
That monthly reading slowed sharply from a 1.4% advance in September and a 0.4% rise in August. Economists polled by Reuters had forecast a 0.4% increase for October, so the monthly print came in a touch softer than expected.
The yearly picture moved the other way. On an unadjusted basis, final demand prices increased 6.5% for the 12 months ended in October, the largest 12-month rise since a 7.4% increase in November 2022.
The Monthly Number Slowed, the Yearly Number Did Not
Producer prices measure what domestic producers receive for their output, before those costs reach store shelves, supplier invoices, and contractor bids. That makes this release an early look at the cost pressure builders and rehab investors will be quoted next.
| October 2026 PPI reading | Month | 12 months |
|---|---|---|
| Final demand (headline) | +0.3%, after +1.4% in September | +6.5%, largest since November 2022 |
| Final demand goods | +0.5%, after +2.5% in September | +10.2%, largest since October 2022 |
| Final demand services | +0.2%, a fifth straight advance | +5.0% |
| Final demand less foods, energy, and trade services | +0.5%, the same as September | +4.9% |
| Final demand foods | +1.3% | +1.7% |
| Final demand energy | -0.1% | +37.0% |
Inside goods, more than 60% of the October advance came from goods less foods and energy, which rose 0.5%. Diesel fuel fell 7.9%, and crude petroleum fell 10.3% among unprocessed goods, which helps explain why the monthly headline slowed even as the yearly rate climbed.
Services rose on transportation. Final demand transportation and warehousing services increased 2.0%, and over 80% of the October increase in final demand services is attributable to truck transportation of freight, which rose 3.9%.
Reuters reported that the annual gain supports expectations the Federal Reserve could keep raising interest rates after a widely expected December hike. That rate path is the other half of this story for housing, because it lands in the same market where mortgage rates fell for a fourth straight week to 7.11% on Freddie Mac's weekly survey, a relief that hotter inflation data puts at risk.
What Builders and Rehab Investors Actually Pay: a Split Ledger
The aggregate index hides the part an investor can use. Materials and components for construction rose 0.7% in October and 6.2% over the 12 months ended in October, with materials for construction up 6.2% in a year and components for construction up 6.1%.
Processed goods for intermediate demand, the pipeline behind those inputs, rose 14.6% over the 12 months, the largest 12-month rise since a 17.2% jump in July 2022. Pipeline pressure that large does not vanish in one softer month.
| Construction input (BLS PPI) | October 2026 | 12 months |
|---|---|---|
| Materials and components for construction | +0.7% | +6.2% |
| Steel mill products | +2.7% | +32.9% |
| Plywood | +2.4% | +16.9% |
| Building paper and board | +5.1% | +13.3% |
| Softwood lumber | -3.1% | +10.6% |
| Fabricated structural metal products | +1.7% | +8.1% |
| Plumbing fixtures and brass fittings | +0.2% | +6.0% |
| Plastic construction products | -0.4% | +5.7% |
| Concrete products | +0.3% | +4.1% |
| Cement | +0.5% | -0.4% |
Finished construction prices tell the same story at the project level. Final demand construction rose 5.5% over the 12 months ended in October, with new health care building construction up 6.0%, new industrial building construction up 5.7%, new warehouse building construction up 5.5%, new office building construction up 5.4%, and new school building construction up 5.3%.
Those increases arrive while the resale market is already frozen by payments. Existing-home sales fell 5.5% in October to a 3.75 million annual pace, the lowest since August 2010, so investors cannot assume a hot exit will absorb a budget that was built on last year's material prices.
How a Beginner Investor Uses a Split PPI Print
The fresh insight in this release is the split itself. A single inflation number would push an investor toward one flat contingency; the line items argue for repricing each trade separately, because steel and lumber are moving in opposite directions this month.
- Re-price the rehab budget line by line. Materials and components are up 6.2% in a year, but cement is down 0.4% and plastic construction products fell 0.4% in October. A flat 10% cushion overpays on some lines and underfunds steel, which is up 32.9% in a year.
- Use the lumber dip before it closes. Softwood lumber fell 3.1% in October even though it is still up 10.6% in a year. If a supplier quote still carries peak pricing, ask for a re-quote in writing this week rather than accepting the old number.
- Lock the risers in writing. Building paper and board jumped 5.1% in October and steel mill products rose 2.7%. On any project starting in the next quarter, get those prices locked with a stated validity period instead of a verbal estimate.
- Watch the two December dates. The Federal Reserve meets December 8-9, and BLS has scheduled the November PPI release for December 15. A second hot annual print would strengthen the case Reuters described for further rate increases, which would pressure the borrowing costs behind every deal.
- Stress-test the carry, not just the build. With new listings down 10.3% and homes taking a median of 65 days to sell in the week ending November 7, a project that runs long on materials also runs long on holding costs. Build both delays into the offer price.
One softer month is not a green light, and one hot year is not a reason to stop buying. It is a reason to buy with a current price sheet: the investors who get hurt by a report like this are the ones still underwriting October 2025 costs in November 2026.
Data source: U.S. Bureau of Labor Statistics, Producer Price Index release for October 2026 (USDL 26-1687), released November 13, 2026. Forecast of a 0.4% monthly increase and the Federal Reserve expectations reported by Reuters, November 13, 2026.
https://www.unitedstatesrealestateinvestor.com/bls-ppi-october-2026-producer-prices-construction-materials-6-2-percent/?fsp_sid=64891


Comments
Post a Comment