United States Foreclosures Hit Highest Level Since 2019
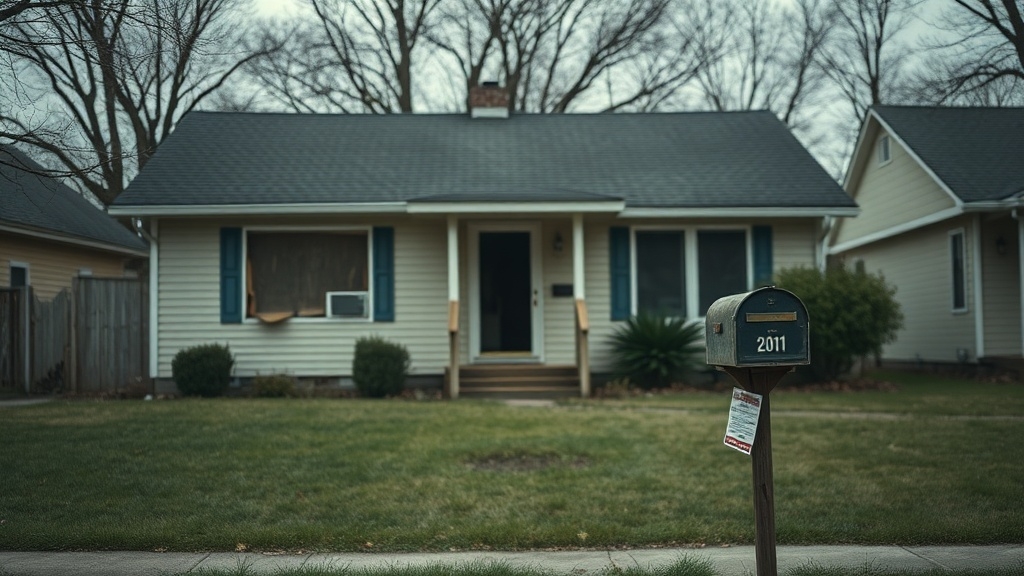
Are US Foreclosures Rising in 2026?
Across the United States, foreclosure activity is rising sharply in 2026, with filings climbing 26 percent year over year in the first quarter to 118,727 properties. In April 2025 alone, 36,033 properties had foreclosure filings nationwide, underscoring the broader foreclosure activity trend. The increase follows eight consecutive months of year-over-year growth in foreclosure filings as of October 2025.
January filings increased 32 percent from a year earlier, followed by a 20 percent rise in February and a 28 percent jump in March.
That pattern signals persistent stress rather than a brief disruption.
Rising Hotspots and Early Warning Signs
Foreclosure starts reached 82,631 in the first quarter, up 20 percent year over year, while completed foreclosures rose 45 percent to 14,020 properties.
These increases suggest more borrowers are moving deeper into distress despite some loan modifications.
The pressure is concentrated in rising hotspots, including Florida, Indiana, South Carolina, Nevada, and Illinois. Florida also posted the nation’s highest foreclosure rates, far exceeding most other states.
Experts expect foreclosure activity to keep increasing through 2026 as housing costs and broader economic pressures strain vulnerable homeowners.
How Today’s Foreclosure Rates Compare Historically
By historical standards, today’s foreclosure rates remain far below the extremes reached during the mortgage crisis. Even as filings climb at a notable pace in 2026, conditions are still well below prior peaks.
In historical context, the national foreclosure rate peaked at 2.23% in 2010. It then fell to 0.11% in 2021 after pandemic-era interventions.
The 2024 rate was 0.23%, which remained below long-term norms. That was about one-eleventh of the crisis-era peak.
At the same time, investors face added uncertainty from legal delays, with average foreclosure timelines reportedly stretching to about 762 days in 2025.
| Measure | Comparison |
|---|---|
| 2010 peak | 2.23% |
| 2021 low | 0.11% |
| 2024 rate | 0.23% |
| June 2026 activity | 1 in 3,656 units |
Early 2026 data showed filings at one in 3,547 homes in January. By June, that figure was one in 3,656.
That pattern suggests normalization from unusually low levels. It does not indicate a return to crisis-era foreclosure conditions nationwide.
What’s Driving More US Foreclosures?
Several forces are pushing more U.S. homeowners into foreclosure. The biggest drivers are the full expiration of pandemic-era protections and the growing strain of higher housing-related costs.
The pandemic aftermath left some borrowers unable to regain stable finances after forbearance ended. This has been especially true among FHA and VA loans.
- Expired relief programs moved struggling borrowers back into the foreclosure pipeline.
- Insurance inflation and property tax increases raised escrow payments sharply.
- Credit card, auto, and student loan burdens reduced money available for housing.
- Higher recent mortgage rates increased payment strain for newer borrowers.
- Foreclosure activity is also rising because timelines are shortening as markets normalize.
- With properties spending fewer days in the process, distress is moving faster.
This combination of financial fragility, payment shock, and reduced protections is driving the national increase.
Which States Have the Worst Foreclosure Rates?
In June 2026, foreclosure pressure was concentrated most heavily in Florida. The state posted the nation’s highest rate at one filing for every 2,106 housing units, totaling 4,871 filings.
Florida stood out not only for its high rate, but also for its large volume of filings. That combination underscored broad distress across the state.
South Carolina ranked second at one filing per 2,374 units, with 1,029 filings. Indiana followed closely at one filing per 2,377 units, with 1,252.
Nevada placed fourth at one filing per 2,508 units. Illinois ranked fifth at one filing per 2,624 units.
Persistent Trouble Signals
South Carolina’s trend remained notable through early 2026. The state also ranked second in April.
Indiana led the first quarter at one filing per 739 units. South Carolina ranked second and Florida third, showing the pressure was sustained rather than isolated nationally.
What More Foreclosures Mean for Buyers and Sellers?
For buyers, the rise in foreclosures creates a narrow opening for lower-cost entry, as lender-owned homes typically sell at steep discounts.
Median foreclosed homes sell about 27% below market value. REO listings reached 1.3% of active listings in April 2026.
Most foreclosure purchases come with repair liabilities. Short sales rose 16% in early 2026.
That improves market entry for bargain hunters, but most foreclosed properties are sold as-is.
Limited inspections and deferred maintenance can erase savings through structural, mechanical, or system repairs.
Seller Strain Deepens
For sellers, rising defaults reflect broader financial stress, as costs outpace wages and insurance premiums climb.
With 228,000 filings in the first half and starts back to 2019 levels, more owners may seek short sales, loan modifications, or forbearance before foreclosure worsens credit damage.
Assessment
Rising foreclosure activity in 2026 signals renewed stress in parts of the U.S. housing market. While levels remain far below the collapse seen during the Great Recession, the increase marks the sharpest deterioration since 2019.
Higher borrowing costs, persistent household strain, and regional economic weakness continue to pressure vulnerable owners.
For buyers, sellers, and lenders, the trend points to a more unsettled market. Distress is becoming more visible, and local conditions matter more than ever.
https://www.unitedstatesrealestateinvestor.com/united-states-foreclosures-hit-highest-level-since-2019/?fsp_sid=54754


Comments
Post a Comment